CANVAS
Start from API_LEVEL
3.0. Please refer to API_LEVEL。
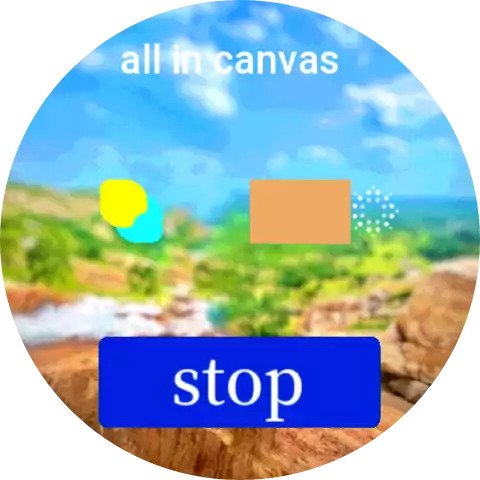
Canvas
Current Canvas capabilities include
- Basic drawing, line, point, rectangle, rectangle fill, ellipse, sector, polygon
- Image drawing
- Text drawing
- Paint
- The canvas is stacked vertically, up to three layers can be stacked
- Clean up the canvas
- Support
addEventListenermethod to listen for user interaction events
Create UI widget
import { createWidget, widget } from '@zos/ui'

const canvas = createWidget(widget.CANVAS, Param)
Param: object
| Properties | Description | Required | Type |
|---|---|---|---|
| x | Canvas x coordinates | YES | number |
| y | Canvas y coordinates | YES | number |
| w | Canvas canvas width | YES | number |
| h | Canvas canvas height | YES | number |
const canvas = createWidget(widget.CANVAS, {
  x: 0,
  y: 0,
  w: 100,
  h: 100
})
canvas.setPaint
Set Paint
setPaint(Param: object): void
Param: object
| Properties | Description | Required | Type |
|---|---|---|---|
| color | Color | YES | number |
| line_width | Line Width | YES | number |
canvas.setPaint({
  color: 0xff0000,
  line_width: 10
})
canvas.drawPixel
Drawing individual pixel point
drawPixel(Param: object): void
Param: object
| Properties | Description | Required | Type |
|---|---|---|---|
| x | x coordinates | YES | number |
| y | y coordinates | YES | number |
| color | Color | NO | number |
canvas.drawPixel({
  x: 0,
  y: 0,
  color: 0xffffff
})
canvas.drawLine
Draws a line segment, with the line width and color set by setPaint paint
drawLine(Param: object): void
Param: object
| Properties | Description | Required | Type |
|---|---|---|---|
| x1 | Start point x coordinates | YES | number |
| y1 | Start point y coordinates | YES | number |
| x2 | End point x coordinates | YES | number |
| y2 | End point y coordinates | YES | number |
| color | Color | NO | number |
canvas.drawLine({
  x1: 100,
  y1: 100,
  x2: 200,
  y2: 100,
  color: 0xffffff
})
Rectangle
- Draw a rectangle path with line width and color set using the
setPaintbrush
strokeRect(Param: object): void
- Draw rectangle fill
drawRect(Param: object): void
Param: object
| Properties | Description | Required | Type |
|---|---|---|---|
| x1 | Start point x coordinates | YES | number |
| y1 | Start point y coordinates | YES | number |
| x2 | End point x coordinates | YES | number |
| y2 | End point y coordinates | YES | number |
| color | Color | NO | number |
canvas.drawRect({
  x1: 60,
  y1: 20,
  x2: 120,
  y2: 60,
  color: 0xff00ff
})
Circle
- Draw a circle path with line width and color set using the
setPaintbrush
strokeCircle(Param: object): void
- Draw circle fill
drawCircle(Param: object): void
Param: object
| Properties | Description | Required | Type |
|---|---|---|---|
| center_x | Center x coordinates | YES | number |
| center_y | Center y coordinates | YES | number |
| radius | Radius | YES | number |
| color | Color | NO | number |
canvas.drawCircle({
  center_x: 80,
  center_y: 140,
  radius: 40,
  color: 0xfff400
})
Ellipse
- Draw a ellipse path with line width and color set using the
setPaintbrush
strokeEllipse(Param: object): void
- Draw ellipse fill
drawEllipse(Param: object): void
Param: object
| Properties | Description | Required | Type |
|---|---|---|---|
| center_x | Ellipse center x coordinates | YES | number |
| center_y | Ellipse center y-coordinate | YES | number |
| radius_x | x-directional axis radius | YES | number |
| radius_y | y-directional axis radius | YES | number |
| color | Color | NO | number |
canvas.drawEllipse({
  center_x: 80,
  center_y: 300,
  radius_x: 60,
  radius_y: 80,
  color: 0xff0000
})
Arc
Compared to drawEllipse, start_angle and end_angle are added to intercept a part of the ellipse from the center of the ellipse as a sector.
- Draw path
strokeArc(Param: object): void
- Draw fill
drawArc(Param: object): void
Param: object
| Properties | Description | Required | Type |
|---|---|---|---|
| center_x | Ellipse center x coordinates | YES | number |
| center_y | Ellipse center y-coordinate | YES | number |
| radius_x | x-directional axis radius | YES | number |
| radius_y | y-directional axis radius | YES | number |
| start_angle | Start angle (0 degrees in the 3 o'clock direction) | YES | number |
| end_angle | Start angle (0 degrees in the 3 o'clock direction) | YES | number |
| color | Color | NO | number |
canvas.drawArc({
  center_x: 280,
  center_y: 200,
  radius_x: 60,
  radius_y: 80,
  start_angle: -150,
  end_angle: -30,
  color: 0xfff400
})
Polygon
- Draw a polygon path with line width and color set using the
setPaintbrush
strokePoly(Param: object): void
- Draw polygon fill
drawPoly(Param: object): void
Param: object
| Properties | Description | Required | Type |
|---|---|---|---|
| data_array | An array of coordinates of at least '3' length | YES | Coordinate |
| color | Color | NO | number |
Coordinate
| Properties | Description | Type |
|---|---|---|
| x | x coordinates | number |
| y | y coordinates | number |
const coordinateArray = [
  { x: 233, y: 30 },
  { x: 130, y: 230 },
  { x: 400, y: 200 },
  { x: 233, y: 30 }
]

canvas.strokePoly({
  data_array: coordinateArray
  color: 0x00ffff,
})
canvas.drawText
Drawing text
drawText(Param: object): void
Param: object
| Properties | Description | Required | Type |
|---|---|---|---|
| x | Text x Coordinates | YES | number |
| y | Text y Coordinates | YES | number |
| text | Text Content | YES | string |
| text_size | Text Size | YES | number |
| color | Color | NO | number |
canvas.drawText({
  x: 200,
  y: 260,
  text_size: 30,
  text: 'Hello Zepp OS'
})
canvas.drawImage
Drawing Image
drawImage(Param: object): void
Param: object
| Properties | Description | Required | Type |
|---|---|---|---|
| x | Image x Coordinates | YES | number |
| y | Image y Coordinates | YES | number |
| w | Image width | YES | number |
| h | Image height | YES | number |
| image | Image path | YES | string |
| alpha | Transparency [0-255], 0 for full transparency | NO | number |
canvas.drawImage({
  x: 0,
  y: 0,
  w: 466,
  h: 466,
  alpha: 255,
  image: 'images/canvas/background.png'
})
canvas.clear
Clean up the canvas by rectangular area
clear(Param: object): void
Param: object
| Properties | Description | Required | Type |
|---|---|---|---|
| x | Rectangle x Coordinates | YES | number |
| y | Rectangle y Coordinates | YES | number |
| w | Rectangle area width | YES | number |
| h | Rectangle area height | YES | number |
canvas.clear({
  x: 400,
  y: 0,
  w: 64,
  h: 64
})
Interaction events
Canvas supports widget.addEventListener to listen for interaction events, see widget.addEventListener(eventId, callback)
import { event } from '@zos/ui'

canvas.addEventListener(event.CLICK_UP, function cb(info) {
  console.log(info.x)
  console.log(info.y)
})